Hands-On Data Visualization
Jack Dougherty and Ilya Ilyankou
A practical guide to building charts, maps, and tables that tell a clear story, using free tools you can start with today. Covers chart selection, spreadsheet and Tableau workflows, interactive maps, and how to spot a misleading graphic.
Loading the book...
Keep reading
-
Next in this topic
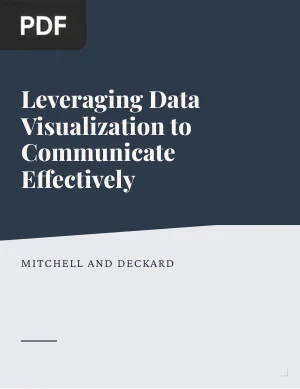
Leveraging Data Visualization to Communicate EffectivelyA course book on turning analysis into a message an audience will act on. Covers choosing the right chart for the question, dashboard design, storytelling with data, and the visual choices that mislead readers without anyone noticing.
Verified PDF · Secure download - Data Visualization in Society
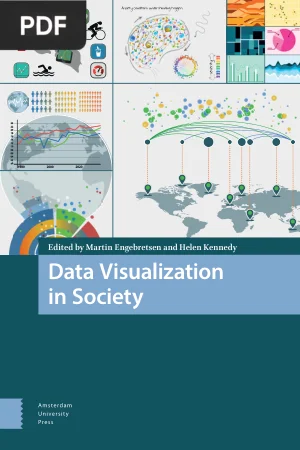
An edited collection on what data visualizations actually do once they reach the public: how people read them, how newsrooms build them, and what gets lost in the translation from dataset to picture. Strong on the ethics and politics of visual data.
Verified PDF · Secure download - Statistics for Research Students
A short, self-testing guide to the statistics a research student actually needs, from descriptive measures and distributions through t tests, ANOVA, correlation, and regression. Worked examples use the free jamovi software.
Verified PDF · Secure download - Statistics: Meaning from Data
A full university statistics course written around the idea that the point of the method is the meaning you extract from the data. Covers sampling, estimation, hypothesis testing, and regression with real datasets at every step.
Verified PDF · Secure download - Introduction to Statistics and Data Analysis for Physicists
A rigorous treatment of the statistical methods used to analyze experimental measurements, covering error propagation, parameter estimation, likelihood, hypothesis tests, and deconvolution. Written for readers working with real experimental data.
Verified PDF · Secure download